

This chapter is an essential guide focusing on the fundamental concepts of epidemiology, research design, and biostatistics. After reviewing this chapter, readers will be equipped with the necessary tools to understand and evaluate research studies, which is essential for evidence-based practice.
Authors: Brian Hanrahan MD, Steven Gangloff MD
Epidemiology
Distribution
Mean
- The average value of a dataset.
- Calculated by summing all values and dividing by the number of values.
- Limitations: Can be misleading in skewed distributions or distributions with outliers.
Median
- The middle value when a dataset is ordered from lowest to highest.
- Ideal for skewed distributions as it is not influenced by outliers.
Mode
- The value that occurs most frequently in a dataset.
- Ideal for skewed distributions as it is not influenced by outliers.
- Examples:
- Modal age of onset of type 1 diabetes
- Modal grade on an easy exam
Skew
- Describes asymmetry in a distribution.
- Positive Skew: The right tail (higher values) is longer.
- Many low values and a few extremely high values.
- Mean > Median > Mode
- Negative Skew: The left tail (lower values) is longer.
- Many high values and a few extremely low values.
- Mean < Median < Mode

Incidence vs. Prevalence
Incidence
- Number of new cases of a condition in a given period.
- Useful for assessing risk and evaluating interventions aimed at preventing disease.
Prevalence
- Total disease cases (new + pre-existing) in a population at one point in time divided by the total population.
- Useful for planning health resource allocation and understanding disease burden
- Not impacted by disease duration or survival rates
- Types of prevalence:
- Point prevalence:
- Percentage of people with the condition at one specific point in time
- Better reflects the burden of chronic conditions
- Lifetime prevalence:
- Percent of individuals that ever had the condition at some point in their life
- Higher than point prevalence for chronic conditions
- Sensitive to survivorship and disease duration
- Point prevalence:

- Key Differences:
- Incidence assesses new case development over time
- Prevalence assesses existing disease cases at one time point
- Incidence excludes pre-existing cases, prevalence includes them
- Incidence assesses risk, while prevalence assesses burden
Statistics
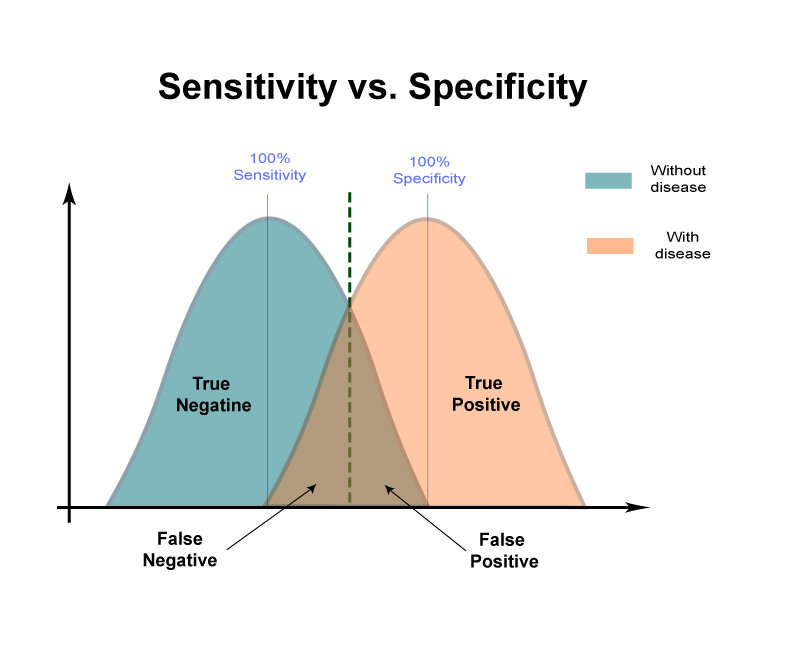
Sensitivity
- Defined as the proportion of people with the disease who test positive on the assessment
- Can also be conceptualized as the true positive rate
- Formula:
- Sensitivity = True Positives / (True Positives + False Negatives)
- A test with high sensitivity correctly identifies a high proportion of people who actually have the disease (few false negatives)
- Example: A Lyme disease screening test with 95% sensitivity would correctly identify 95% of people with Lyme disease.
Specificity
- Defined as the proportion of people without the disease who test negative on the assessment
- Also conceptualized as the true negative rate
- Formula:
- Specificity = True Negatives / (True Negatives + False Positives)
- A test with high specificity correctly rules out most people who do not have the disease (few false positives)
- Example: A cognitive screening test for dementia with 98% specificity would generate few false positive results, correctly identifying 98% of patients without dementia as testing negative.
Positive Predictive Value (PPV)
- Defined as the probability that a person with a positive test result truly has the underlying disease
- Depends on the sensitivity, specificity, and disease prevalence
- Formula:
- PPV = True Positives / (True Positives + False Positives)
- A test with high PPV means a positive result has a high probability of reflecting the true presence of disease
- Example: If a suicide risk screening test has a PPV of 90%, then 90% of patients screening positive are truly at high risk for suicide.
Negative Predictive Value (NPV)
- Defined as the probability that a person with a negative test result truly does NOT have the underlying disease
- Depends on the sensitivity, specificity, and disease prevalence
- Formula:
- NPV = True Negatives / (True Negatives + False Negatives)
- A test with high NPV means a negative result reliably rules out the presence of the disease
- Example: If a screening test for CJD has an NPV of 97%, only 3% of patients screening negative actually have CJD (low false negative rate).
Research Designs
Types of Studies
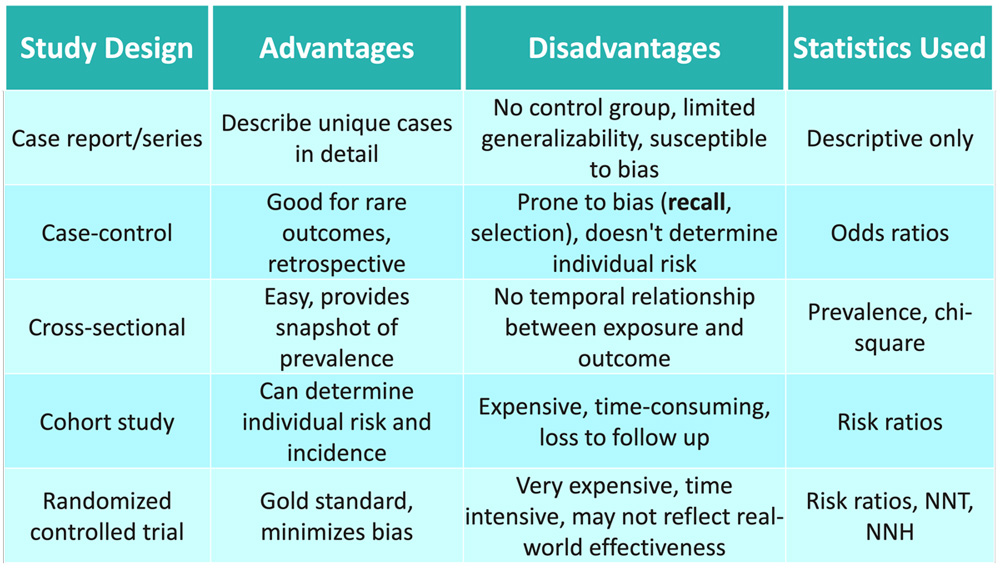
Case report/series
- Detailed description of a single clinical case or small group of cases
- Mainly descriptive, with no comparisons to a control group
- Used to illustrate unique cases without evidence of causality
- Hypothesizes about ideas that can be investigated further with better quality research
- Example:
- A report on an individual patient diagnosed with Wilson’s disease that describes their symptoms, diagnosis, and treatment response.
Case-control study
- Compares cases (with an outcome) to controls (without outcome) to identify factors associated with the outcome
- Retrospective design: starts with the outcome and then investigates exposures
- Useful for studying rare diseases or outcomes with long latency periods
- Primary statistics are odds ratios quantifying the level of association
- Example:
- A study comparing the prevalence of chemical exposure at Camp Lejeune between patients diagnosed with Parkinson’s disease and healthy controls without the diagnosis.
Cross-sectional study
- Analyzes the relationship between exposures and outcomes at a single point in time
- Useful for disease prevalence and studying multiple outcomes
- Cannot determine temporal sequence between exposure and outcome
- Primary statistics are prevalence ratios/odds ratios
- Example:
- A study surveying the prevalence of essential tremor in octogenarians at a single point in time.
Cohort study
- Follows population prospectively to quantify outcome risk
- Groups are defined by exposure status
- Establishes temporal relationship between predictors and outcomes
- More expensive and time-intensive than cross-sectional studies
- Primary statistics are risk ratios quantifying relative risk
- Example:
- A multi-year study following a group of children into adulthood to track rates of diagnosis of multiple sclerosis and to identify predictive factors.
Randomized control study
- The gold standard experimental study in which participants are randomly allocated to study groups
- Highest internal validity due to randomization minimizing bias
- Establishes causality between intervention and outcome
- Primary statistics are risk ratios comparing outcomes between groups
- Example:
- A trial randomly assigning patients with amyotrophic lateral sclerosis to receive either a new medication or placebo, to compare treatment efficacy.
Efficacy Trials
- Measure whether interventions produce the intended result under ideal/controlled conditions
- Tight inclusion criteria and close monitoring
- Maximize internal validity
Effectiveness Trials
- Examine whether intervention works under real-world conditions
- Broader inclusion, more variability in delivery/adherence
- Prioritize generalizability and applicability
Crossover Trials
- Participants receive a sequence of different treatments
- Useful when:
- Disease course is stable
- Treatment effects short-term or reversible
- Minimizes sample size required
- Must account for treatment carryover effects
Naturalistic Studies
- Investigate interventions under routine clinical practice conditions
- Broad inclusion criteria, less frequent monitoring
- Findings complement efficacy data on effectiveness
Twin Studies
- Compare trait frequency between identical vs. fraternal twins
- Estimate genetic components of disease by parsing genetic versus environmental effects
Adoption Studies
- Assess trait rates among biological versus adoptive relatives
- Also estimates genetic versus environmental disease components
Meta-Analysis
- Statistically synthesizes data from multiple smaller studies to gain Power
- Can assess consistency or heterogeneity across studies
- At risk for selection and publication bias
- Example:
- A statistical analysis combining data from multiple studies examining the efficacy of antiplatelets for stroke prevention to determine the overall treatment effect size across trials.
Association Studies
- Correlate genetic variants and other biomarkers to disease states
Pragmatic Trials
- Emphasize applicability by testing interventions in typical “real world” practice settings with more heterogeneous patients and conditions.
Statistical Measures in Research Studies
Odds ratio (OR)
- Quantifies the association between an exposure and an outcome comparing the odds of the outcome occurring in the exposed group to the odds of the outcome occurring in the unexposed group.
- Formula:
- OR = (A/B) / (C/D)
- A = Cases exposed
- B = Controls exposed
- C = Cases unexposed
- D = Controls unexposed
- OR = (A/B) / (C/D)
- Interpretation:
- OR > 1 means exposure increases odds
- OR < 1 means exposure decreases odds
- OR = 1: No association between exposure and outcome.
- Used in case-control studies as a proxy for relative risk
- Does not provide information about actual risk or incidence and does not imply causation
Relative risk (RR)
- Compares the risk of an outcome among an exposed group to the risk in an unexposed group
- Provides information about the actual likelihood of the outcome occurring.
- Formula:
- RR = Incidence in exposed / Incidence in unexposed
- Incidence = Number with disease / Number without disease
- RR = Incidence in exposed / Incidence in unexposed
- Interpretation:
- RR > 1: Increased risk in the exposed group.
- RR < 1: Decreased risk in the exposed group.
- RR = 1: Equal risk in both groups.
- Directly approximates incidence risk
- Used frequently in cohort studies
Absolute risk reduction (ARR)/increase (ARI)
- ARR: The difference in outcome rates between control and experimental groups.
- ARR = Control event rate – Experimental event rate
- ARI: The increase in event rates in the experimental group compared to the control.
- ARI = Experimental event rate – Control event rate
- Provides a direct measure of the benefit or harm.
Relative risk reduction (RRR)/increase (RRI)
- Translates the absolute risk reduction or increase into a percentage value
- Makes interpretation of efficacy easier clinically
- Formulas:
- RRR = |ARR| x 100 / Control event rate
- RRI = |ARI| x 100 / Experimental event rate
Number needed to treat (NNT)/harm (NNH)
- Number of people needed to treat in order for one additional patient to benefit/experience harm.
- Formulas:
- NNT = 1/ARR
- NNH = 1/ARI
Hazard ratio (HR)
- Compares the hazard (rate of an event) between groups over time.
- HR = Treatment hazard rate / control hazard rate
- Interpretation:
- HR > 1: Increased rate of outcome with exposure.
- HR < 1: Decreased rate of outcome with exposure.
- Used in survival analysis.
Attributable risks
- Used to determine how much disease burden in a population can be attributed to a risk factor.
- Attributable risk percent/proportion: Proportion of disease in the exposed group attributable to the exposure.
- Population attributable risk percent: Proportion of disease in the whole population attributable to the exposure.
Biostatistics
Hypothesis Testing
- In research, statistical analyses evaluate hypotheses about treatment effects. This involves stating a null and alternative hypothesis
Null Hypothesis (H0)
- Asserts there is no true difference between groups or no effect of treatment
- Essentially the “status quo” scenario
- Default position unless evidence indicates otherwise
- Form: “There is no difference between treatment A and B”
Alternative Hypothesis (H1)
- What investigator hopes to prove with study data
- Asserts there is a true difference or treatment effect
- Contradicts the null hypothesis
- Form: “There is a difference between treatment A and B”
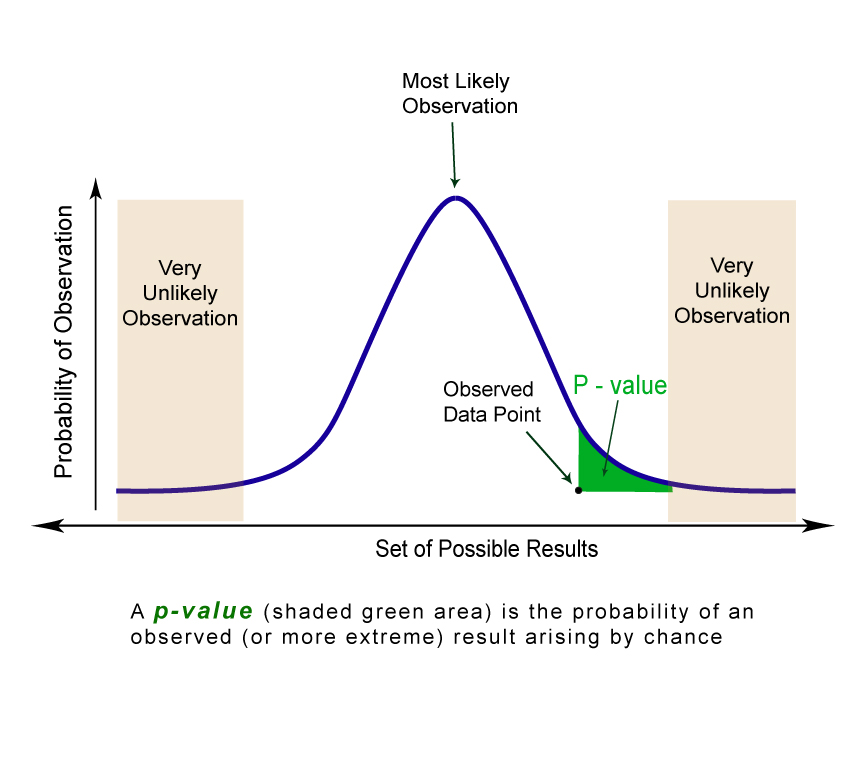
p-values and Statistical Significance
- p-value: Probability of obtaining results ≥ the observed effect if the null hypothesis is true
- Low p-value → reject null hypothesis
- Typical threshold p ≤ 0.05
- A statistically significant result does not necessarily imply clinical importance
- Even large sample studies with tiny differences that are statistically significant may lack clinical significance or practical importance.
Confidence Intervals
- Range of values expected to contain the true parameter
- Influenced by the size and variability of the sample
- Wider intervals → less precision, less confidence in observed effect size
- Narrower intervals → greater confidence in point estimate
- 95% CI has 95% probability of containing the true value
- Help assess clinical significance beyond statistical hypotheses
Error Types
Type I error
- Incorrectly concluding a difference/effect is real, when it is not
- Equivalent to a false positive result / false rejection of null hypothesis when it was true
- Probability determined by alpha level (typically 0.05 or 5%)
Type II error
- Failing to detect a true effect or difference → a false negative finding
- Concluding there is no effect when one actually exists
- Determined by the power of the study, which depends on sample size
Type III error
- Asking the wrong research question entirely
- No meaningful answer, regardless of the statistical findings
- May represent a flawed study design or mismatched hypotheses
Analysis methods
Regression analysis
- Models the relationship between multiple variables and a dependent variable.
- Determines how strongly/weakly one variable predicts or influences another
- Quantifies the effect size for each predictor
- Example:
- An analysis that would test which factors are significantly associated with a higher or lower likelihood of developing Guillain-Barre syndrome, after controlling for the other variables
Chi-square test
- Compares observed and expected frequencies between categorical variables.
- Determines the likelihood of differences from chance alone.
T-test
- Compares means between two groups.
- Can be paired or independent samples.
- Determines statistical probability that group differences are significant.
ANOVA
- Compares means across more than two groups.
- Determines the likelihood that all group means are equal.
Two-way ANOVA
- Determines the effects of two independent categorical variables and any interaction between those variables.
Data interpretation
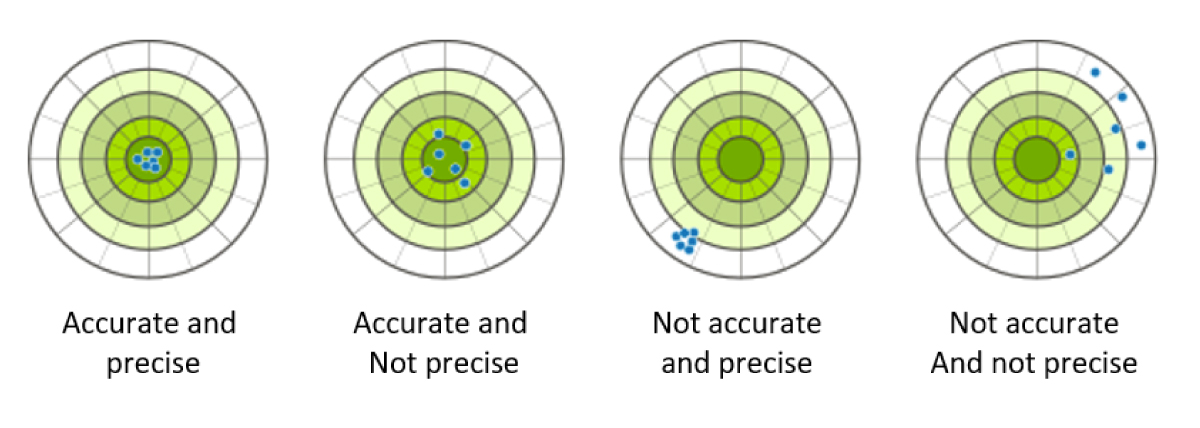
Accuracy
- Refers to how close a measurement or estimate comes to the true value
- High accuracy means the given value is quite close to the real one
- Improves with advanced equipment, protocols, and reviewer training
- For example, a functional assessment scale with demonstrated accuracy reliably approximates the patients’ true functional impairment.
Precision
- Degree of reproducibility and agreement in repeated measurements in the same condition
- High precision means obtaining the same or similar scores upon retesting
- For example, a cognitive assessment with strong precision will generate very similar scores when the same patient repeats the test under standard conditions over a short interval.
Interrater reliability
- Level of score agreement when different raters measure the same group.
- Enables reliable comparisons between providers
- For example, strong interrater reliability between clinicians administering a development assessment means discrepant child development profiles reflect true performance differences rather than rater subjectivity.
- Reliability is necessary for measurements to be considered valid indicators of the intended parameter.
- Lack of reliability undermines overall result credibility and application.
Validity
- High validity across domains supports confidence in the credibility and meaningfulness of findings for clinical application and decision-making.
- Internal validity:
- Refers to whether a study establishes a true cause-effect relationship between treatment and outcome rather than being obscured by biases and confounding
- Critical in determining efficacy
- Ensured by proper study design/controls to minimize systematic biases
- External validity:
- Refers to the generalizability of findings to broader patient populations and real-world medical settings
- A representative, heterogeneous sample enhances external validity
- Findings applying only narrowly may lack relevance
- Content validity:
- Whether an instrument or assessment comprehensively measures and represents all facets of the intended parameter or construct
- Ensured by careful instrument development and expert input
- Construct validity:
- The extent to which a test accurately measures the theoretical concept or trait it purports to measure
- Ensured by correlating test performance to other metrics of the same construct
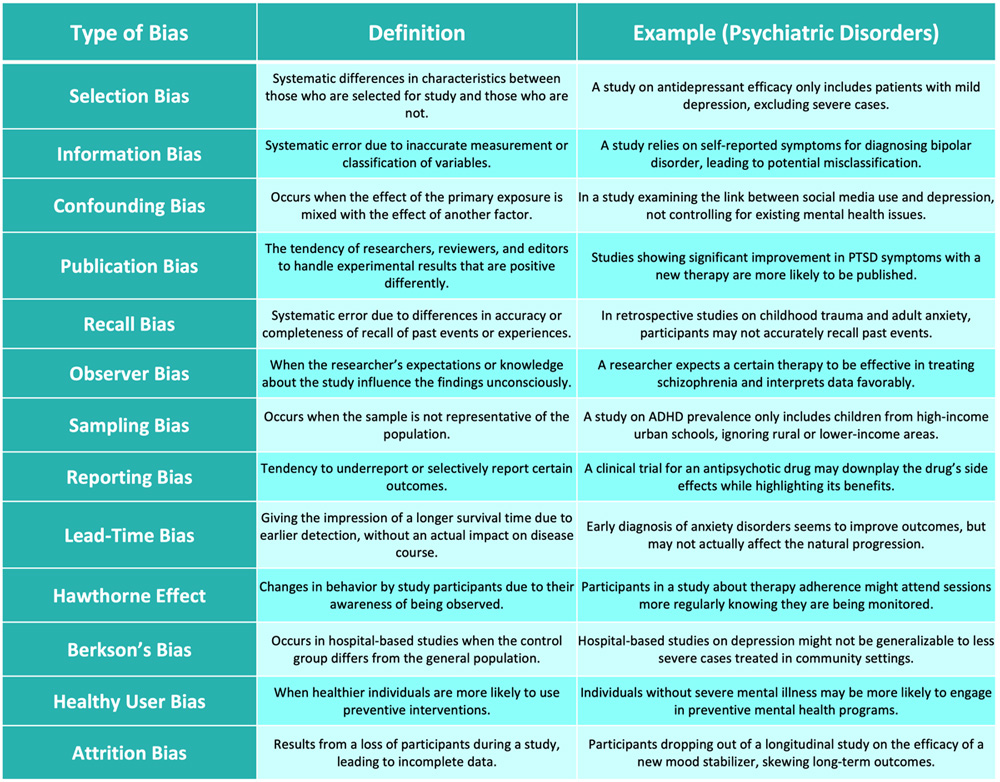
Biases
- There is a range of biases that can occur in research. Awareness of these biases is crucial for designing robust research studies and interpreting their results accurately.
Confounders
- Variables that distort the observed relationship between independent and dependent variables.
- Ways to address confounders:
- Randomization: Randomly allocates participants to study groups to distribute confounders similarly at baseline
- Matching: Matches participant characteristics across study groups
- Restriction: Limits participants based on potential confounding variables
- Multivariable analysis: Statistically adjust for confounders in analysis if imbalances exist after randomization
- Multiple control groups: Allows isolation of potential confounder effects
References
- Akobeng, Anthony K. “Understanding type I and type II errors, statistical power and sample size.” Acta Paediatrica 105.6 (2016): 605-609.
- Chitsaz, E., & Kumar, S. (2019). Understanding the Interpretation of Disease Incidence and Prevalence. Clinical Epidemiology of Chronic Liver Diseases, 25-31.
- Greenland, Sander, and Hal Morgenstern. “Confounding in health research.” Annual review of public health 22.1 (2001): 189-212.
- Illowsky, B., & Dean, S. (2013, September 19). Introductory Statistics. OpenStax. https://openstax.org/books/introductory-statistics/pages/1-introduction
- Kamper, Steven J. “Reliability and validity: linking evidence to practice.” Journal of Orthopaedic & Sports Physical Therapy 49.4 (2019): 286-287.
- Šimundić AM. Measures of Diagnostic Accuracy: Basic Definitions. EJIFCC. 2009;19(4):203-211. Published 2009 Jan 20.
- Munnangi S, Boktor SW. Epidemiology Of Study Design. [Updated 2023 Apr 24]. In: StatPearls [Internet]. Treasure Island (FL): StatPearls Publishing; 2023 Jan-. Available from: https://www.ncbi.nlm.nih.gov/books/NBK470342/
- Pannucci, Christopher J., and Edwin G. Wilkins. “Identifying and avoiding bias in research.” Plastic and reconstructive surgery 126.2 (2010): 619.
Loading table of contents...
Loading table of contents...
Log in to View the Remaining 60-90% of Page Content!
Important: If you signed up after 1/1/2026, or if you opted to migrate your old account to the new & improved platform (same great content, better experience), please log in at nowyouknowmed.com
New here? Get started!
(Or, click here to learn about our institution/group pricing)1 Month Plan
Full Access Subscription
$142.49
$
94
99
1 Month -
Access to full question bank
-
Access to all flashcards
-
Access to all chapters & site content
3 Month Plan
Full Access Subscription
$224.98
$
144
97
3 Months -
Access to full question bank
-
Access to all flashcards
-
Access to all chapters & site content
1 Year Plan
Full Access Subscription
$538.47
$
338
98
1 Year -
Access to full question bank
-
Access to all flashcards
-
Access to all chapters & site content
Popular